Unsere Kunden optimieren bereits erfolgreich ihre Produktionsplanung mit der ipolog Software. Finden Sie heraus wie und lesen sie unsere Erfolgsgeschichten.
What can be accomplished with ipolog software?
Die Software ipolog begleitet Sie in allen Phasen der Planung und Optimierung Ihrer Fabrik. Beim ersten Konzept „auf der grünen Wiese“ oder auch in Ihrer bestehenden Fabrikhalle. Im digitalen Modell (digitaler Zwilling) Ihrer Fabrik können Sie noch vor “start of production” (SOP) alle Hindernisse identifizieren und Abläufe optimieren.
Holistic planning in a digital twin
Your entire factory is completely mapped with ipolog in the digital twin and can be optimized accordingly.
2D and 3D visualization
Simulation
Simulate processes (such as employee routes) and detect bottlenecks before they occur. Integrated line-back optimization in ipolog gets you away from “trial & error”!
Calculation with detailed data
Reports & KPIs
What are the advantages of the software?
Accelerate decision making processes
Shared understanding about processes through 3D visualization creates improved communication across all levels.
One software instead of many tools
Work across departments using one tool. Everyone has the same status and the same expectations.
Use existing data & build iteratively
Existing data is imported through intelligent interfaces and can be used as a basis for your initial planning.
Intuitive operation - First model after two days
Thanks to the intuitive user interface, the first models can be created after only two days of training. No programming knowledge is necessary.
What can ipolog be used for?

Logistics Planning
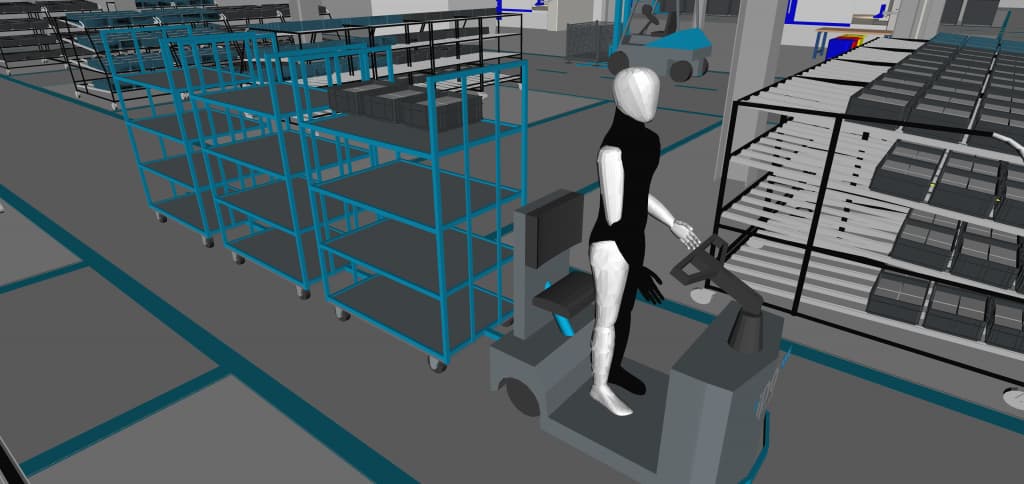
Logistics planning in ipolog creates transparency, improves capacity utilization and helps acheive a smooth material flow. Tugger trains, forklifts and AGVs can be automatically clocked.

Assembly Planning
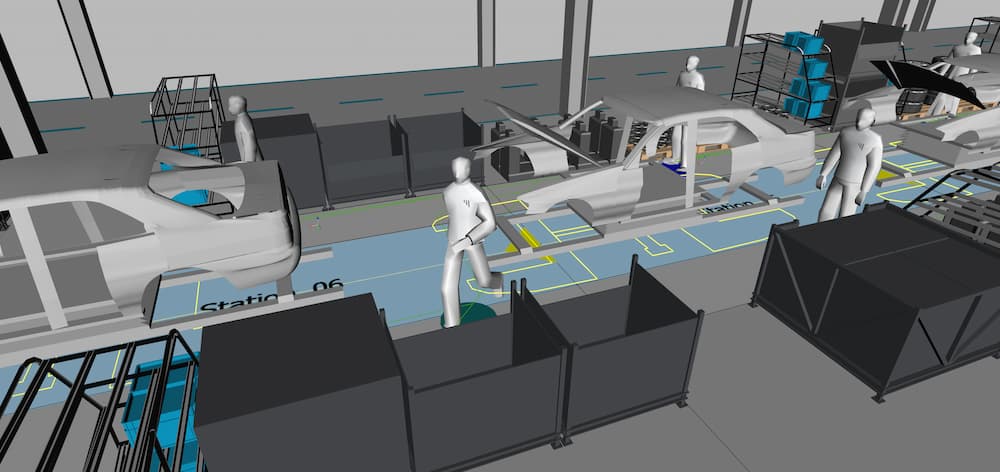
Our software allows for the visualization of processes and material provision (assembly lines or individual work stations) directly in the factory layout complete with a worker path simulation.

Material Supply Planning
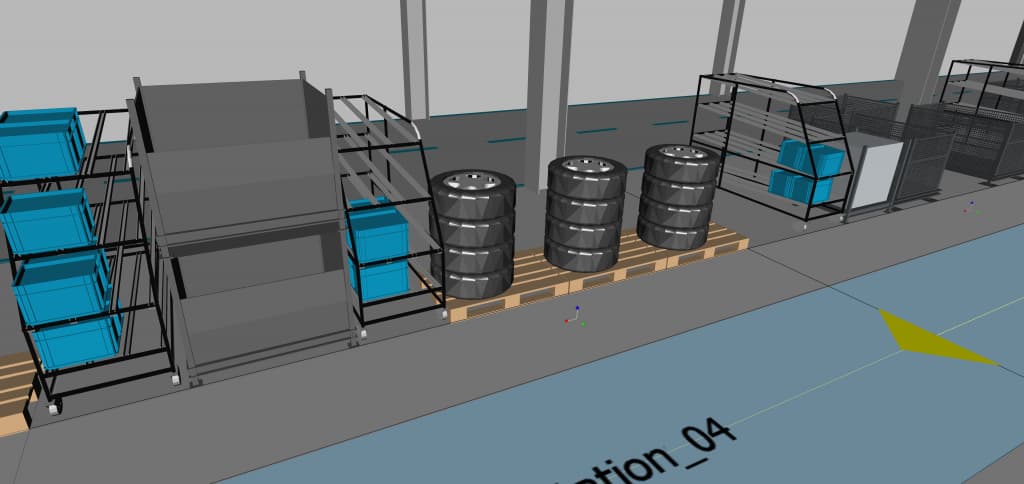
Reduce the required planning time for material supply through intelligent algorithms and transparent visualization in 2D and 3D. This includes material supply to machines, production lines or individual workstations in assembly. Avoid waste and optimize picking!
The software in numbers – how to optimize your production planning
%
Project duration
An accelerated and structured planning process sets standards and shortens project duration by up to 30 percent.
%
Utilization rate
Utilization of operational staff and resources in assembly and logistics can be increased by up to 20 percent.
%
Walkways
Minimizing worker walkways in assembly and picking get rid of up to 50 percent of non-value-adding activities.
%
Required effort for modifications
Adjust changes at the touch of a button: It is no longer necessary for several people to adjust a multitude of documents in Excel, Visio or CAD.
What does planning look like in ipolog?
Define basics
Joint preparation of the planning premises
Import data
Model processes
Simulate & visualize scenarios
Optimize processes
Do you also face the following challenges?
I never know what the effect of a changed production program will be
New senarios can be simulated and evaluated in ipolog even after the new production program has been imported. With our software you can simulate the next day in detail or roughly plan the next year.
It takes me hours to update all files and lists even for small changes
ipolog integrates your data to provide you with a comprehensive understand of your assembly processes and material flow. Changes can be easily imported and the effects can be viewed immediately.
I don't know what my material flow looks like - I can't visualize or quantify it
You can create one-click Sankey diagrams as well as evaluate various material flows in ipolog to accurately quantify production logistics requirements.
I have to search for hours to find data for management reports
In ipolog all data is bundled into one tool. No more annoying asking around and searching. Results are clearly arranged in evaluation modules so that everything is available at a glance. You can simulate processes and visualize them in 3D to provide management and colleagues with a better overview.
If I don't want to use average values, I reach my limit with Excel
Simulate different scenarios in ipolog and compare them with each other, all on the basis of detailed values. A concrete production program with the sequence of orders is taken into accout to make the effects on production and logistics visible.
I lack KPIs and visualizations that help me make decisions and improve processes

Thanks to the detailed key figures and 3D visualization in ipolog, you can immediately recognize bottlenecks. The stocks on the line, parts per container and worker paths can be adjusted to reduce material handling costs. Furthermore, material flow can be simulated and delivery routes and material zones can be optimized as part of logistics planning.
Each department works with different tools
ipolog provides you with the opportunity to plan across departments because all data is collected into one tool.
I never know what impact a change to the model mix will have on the assembly and assembly workers
Immediately see where bottlenecks are located. You can compare different scenarios in ipolog to preview planned changes and avoid negative outcomes.
Interested? We are happy to answer your questions!
You are currently viewing a placeholder content from HubSpot. To access the actual content, click the button below. Please note that doing so will share data with third-party providers.
More Information

